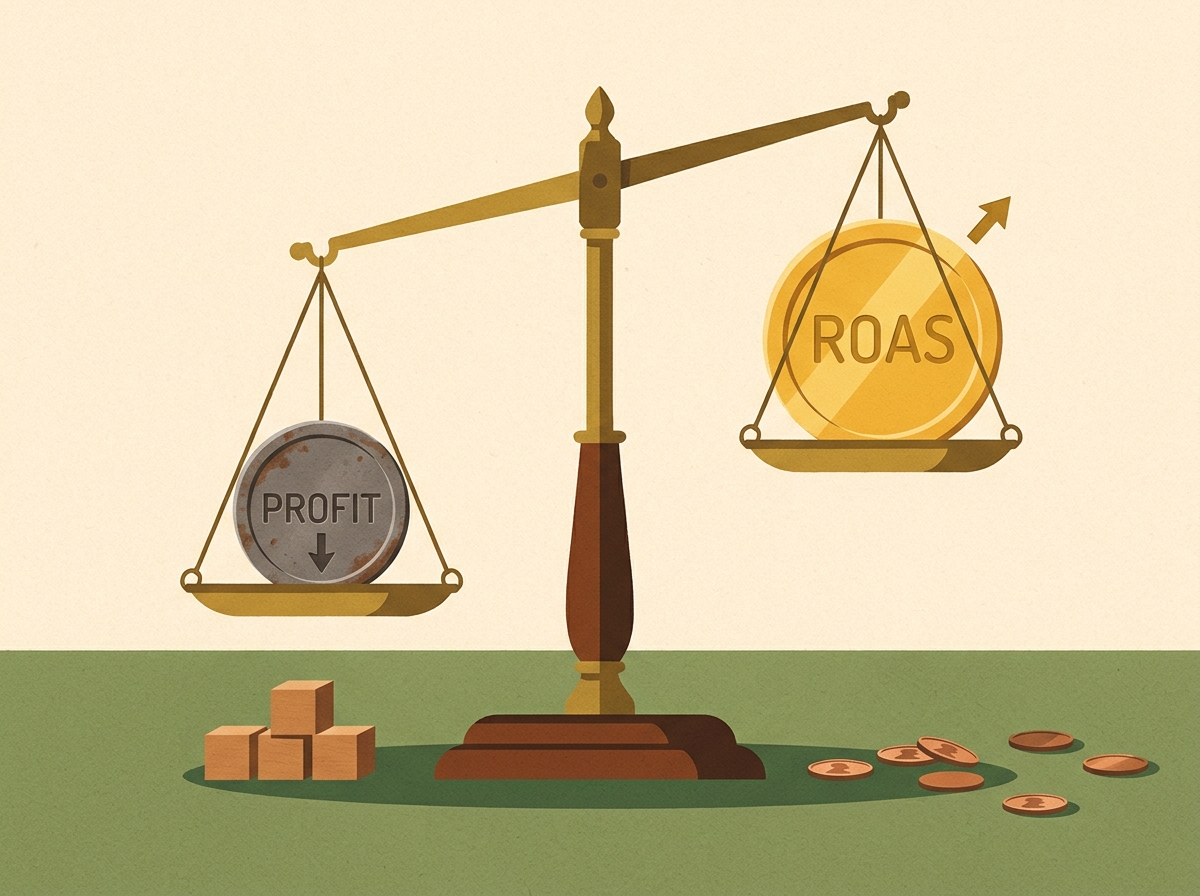
Why your 3x ROAS campaign might still be losing money
A high ROAS looks like a clear win. But once you account for product cost, GST, shipping, and returns, many "successful" campaigns are quietly losing money. This guide shows you how to see the real numbers.
- Understanding What a 3x ROAS Can Hide
- Calculating the Real Metric: Break-Even ROAS
- Factoring in Returns and RTO
- Comparing ROAS vs. POAS: The More Honest Metric
- Key Takeaways for Profit-Driven Ad Spend
Can a 3x Return on Ad Spend (ROAS) lose you money? Absolutely. ROAS only measures the revenue generated for every dollar spent on advertising. It ignores crucial costs like GST/VAT, product manufacturing, shipping, payment gateway fees, and returns (RTO). For a typical D2C brand with a 30-35% margin after these costs, the break-even ROAS is often near 3x. This means a 3x campaign is barely profitable, and anything less is a loss. To truly understand performance, you must judge campaigns on profit per order, not just ROAS.
ROAS is the first metric every brand owner checks. A 3x return seems healthy—for every ₹10 lakh in ad spend, you get ₹30 lakh back. So the campaign must be profitable, right? Not necessarily. ROAS provides a limited view, focusing only on revenue versus ad spend. It omits the actual cost to produce and deliver your product. When taxes like GST are included in the price, the picture gets even more skewed. Let's break down how a "3x winner" can actually be a financial drain.
What's Hidden Behind a 3x ROAS?
Let's use a simple example. Imagine you sell a T-shirt for ₹999, and your campaign is consistently delivering a 3x ROAS on a ₹20 lakh monthly spend.
| Metric | Value |
|---|---|
| Selling Price (AOV) | ₹999 |
| Ad Cost (at 3x ROAS) | ₹333 |
| Product, Shipping & COD Fees | ₹520 |
| "Profit" Per Order (Before GST) | ₹146 |
On paper, a 3x ROAS and a ₹146 profit per order look good. However, this calculation is missing a key component: the ₹999 price includes GST.
How GST Wipes Out Your Profit
With an 18% GST rate in India, ₹152 from each ₹999 sale goes directly to the government. Factoring this in changes the calculation completely:
| Per Order Breakdown | Amount |
|---|---|
| Price Paid by Customer | ₹999 |
| GST (18%) | − ₹152 |
| Product, Shipping & COD Fee | − ₹520 |
| Ad Cost (at 3x ROAS) | − ₹333 |
| Real Profit Per Order | − ₹6 |
Suddenly, that "winning" 3x campaign is losing ₹6 on every single order. On a spend of ₹20 lakh, which translates to about 6,000 orders, you're losing approximately ₹36,000 every month—and that's before accounting for a single return.
How Do You Calculate Break-Even ROAS?
Instead of aiming for an arbitrary ROAS target, every brand needs to know its break-even ROAS—the point at which an order starts to lose money. The formula is straightforward:
Break-even ROAS = Selling Price / (Price without GST/VAT − All Non-Ad Costs)
Using our example: ₹999 / (₹847 − ₹520) = 3.06x. This means the 3x campaign was running just below the profitability threshold, even though it looked positive on the surface. As one Klaviyo guide puts it, anything below this number is a paid loss.
Why Do Returns and RTOs Inflate Your Losses?
Returns are a major drain on D2C profits, particularly for cash-on-delivery (COD) orders common in India and the Gulf. When a customer returns an order, you often lose money on forward shipping, reverse shipping, and sometimes the product itself. A campaign with a decent ROAS can quickly become unprofitable once you factor in a standard return rate.
The Impact of RTO on Your Break-Even Point
Let's say forward shipping is ₹70 and reverse shipping is another ₹70. If 15% of your orders are returned, you lose the two-way shipping costs on those sales without making any margin. For our ₹999 T-shirt, this raises the break-even ROAS from 3.06x to approximately 3.9x.
Where Ad Platforms Fall Short
Meta and Google track a purchase as soon as an order is placed. An RTO (Return to Origin) is still counted as revenue in their dashboards. To get an accurate picture, you need to compare the revenue reported by the ad platform with your actual delivered revenue. The only way to see the truth is to compare platform revenue with your delivered revenue from a source like Shopify's ROAS calculator or your courier panel.
To find your real ROAS, take last month's total ad spend and divide it by the revenue from only the orders that were successfully delivered and paid for (excluding GST/VAT). This is your delivered ROAS. The gap between this number and what Ads Manager reports is typically your RTO rate and taxes combined.
What Actions Can You Take?
- Incorporate Real Costs into Reporting: Factor in GST/VAT, product costs, shipping, packaging, and an average return rate. Judge campaigns on profit, not just ROAS.
- Set Pause Rules Based on Break-Even ROAS: A rule like "pause if ROAS is under 2x" is arbitrary if your break-even point is actually 3x.
- Monitor Profit Per Campaign: A high blended ROAS can obscure underperforming campaigns. Analyze each one individually.
- Encourage Prepaid Orders: A small discount for prepaid orders often costs less than the losses incurred from COD returns.
Is POAS a Better Metric Than ROAS?
An increasing number of brands are tracking POAS (Profit on Ad Spend). This metric is calculated as Gross Profit / Ad Spend. A POAS above 1.0 indicates your ads are profitable; below 1.0 means you're losing money on each sale.
| ROAS | POAS | |
|---|---|---|
| Formula | Revenue / Ad Spend | Gross Profit / Ad Spend |
| Includes Product Cost? | No | Yes |
| Break-Even Point | Varies per product | Always 1.0 |
| Easy to Track? | Yes (in Ads Manager) | Only if you send profit as the conversion value |
You don't need to overhaul your entire reporting system overnight. Use ROAS to measure ad efficiency and POAS or break-even ROAS to determine actual profitability. For a deeper dive, check out this Investopedia article on the nuances of ROAS. You can also read more about ROAS bidding in Google Ads and value-based bidding in Meta Ads.
The Final Takeaway on ROAS vs Profit
ROAS is a useful metric for gauging ad efficiency, but it doesn't tell the whole story. The brands that scale successfully are those that look beyond vanity metrics and focus on what truly matters: profit per order, after all costs are accounted for.
EngageReel helps close this gap. By integrating your real costs, it calculates your break-even ROAS and provides clear insights on which campaigns to scale, pause, or optimize based on actual profit, not just revenue. Learn how EngageReel gives you the full picture.
Frequently asked questions
Is a 3x ROAS good?
A 3x ROAS is good only if your break-even ROAS is significantly lower. For a business with a 50% profit margin before ad spend, the break-even ROAS is 2x, so a 3x ROAS is profitable. However, for a business with a 33% margin, the break-even is 3x, meaning a 3x ROAS campaign is only breaking even, not making a profit.
What is POAS?
POAS, or Profit on Ad Spend, is a metric that calculates profitability by dividing gross profit by ad spend. A POAS over 1.0 means the campaign is profitable. It is generally considered a more accurate measure of an ad campaign's financial success than ROAS because it includes the cost of goods sold.
Why is the ROAS in Ads Manager different from my actual profit?
The ROAS shown in platforms like Meta Ads Manager or Google Ads is often inflated because it tracks revenue at the point of sale and doesn't account for costs such as GST/VAT, shipping, or product costs. Furthermore, it doesn't deduct revenue from orders that are later returned or cancelled (RTO), leading to a discrepancy between the reported ROAS and your actual profit.
What ROAS should I aim for with COD-heavy products?
For products with a high rate of Cash on Delivery (COD) orders, you need to set a higher ROAS target to remain profitable. First, calculate your break-even ROAS, making sure to include the average cost of returns and RTOs. Then, add your desired profit margin on top of that to determine your target ROAS. This will ensure you're covered for the additional costs associated with COD.
Should I stop using ROAS?
You shouldn't stop using ROAS altogether, as it's still a valuable indicator of your advertising efficiency. However, it should not be the only metric you track. For a complete picture of your campaign's performance, you should always analyze ROAS in conjunction with other metrics like break-even ROAS and profit per order to make informed decisions.